App Builder \ Screens
Summary Screen

App Builder & Automation Expert
Stay Updated with ProcFu!
Subscribe to our newsletter for the latest tips, updates, and automation insights.
Subscribe NowAbout the Summary Screen
The Summary Screen functions as an index screen, allowing you to display a list of multiple items from a data source in various formats such as a table, cards, map, spreadsheet, or calendar (beta) view. This feature provides a versatile way to present data depending on your needs.
Key Features of the Summary Screen
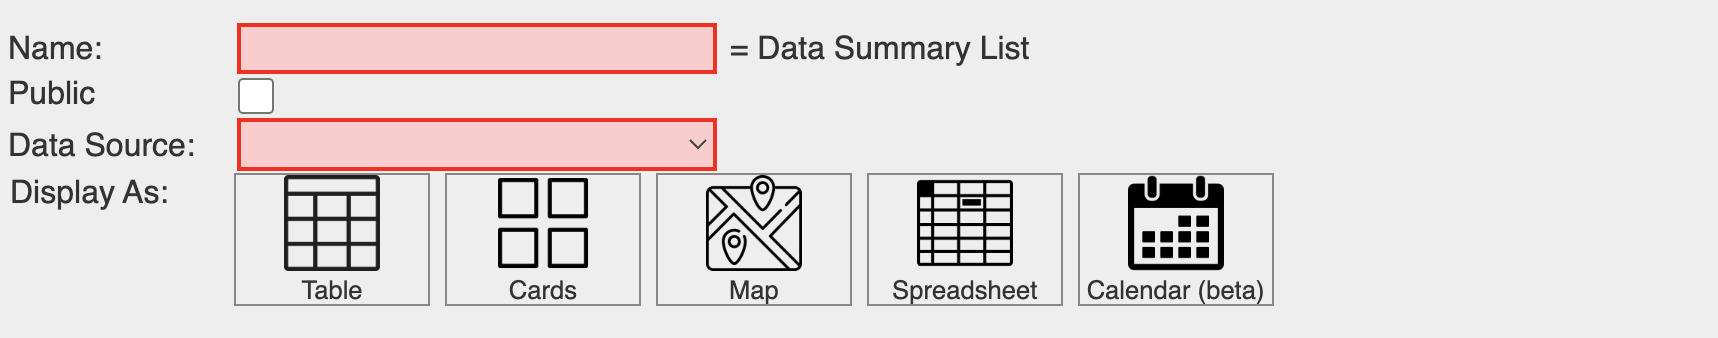
Name Field
There is a "Name" textfield to name the screen suitably.
Public Access Option
There is a "Public" checkbox. If enabled, the screen can be accessed publicly without authentication, making it easy to share data with a wider audience.
Data Source Selection
You can choose from several data sources: Podio, MySQL, InfoLobby, or Notion.
Once a data source is selected, you can drill down further to select the specific app or table.
Data Filtering Options
Once the data source is chosen (excluding MySQL), there are five filtering options available
- All Items: Display all items, with options to sort by field name in ascending or descending order.
- All Items with Search: Similar to the "All Items", with options to sort by field name in ascending or descending order, but includes a search feature for easier data filtering.
- View (For InfoLobby or Podio): Allows you to select data from a particular view of InfoLobby table or Podio App.
- Related Items: Displays items related to the current context item. You can select the relationship app and relationship field that defines their relationship.
- Related Items with Custom Filter: Further filters data that has already been filtered by relationship using a custom filter created with JSON.
- Custom Filter: Directly filters the data table using a JSON filter. Here are some examples of custom filters.
For MySQL, there is a field to enter the Where Condition directly for custom SQL filtering.
Display Options
Once data is selected and filtered, you can choose how to display it:
- Table View: Presents data in a table format. You can select which fields to show, reorder them, and change field labels.
- Cards View: Displays data as cards. Similar customization options are available, including selecting fields, reordering, and choosing an image field for a featured image.
- Map View: Plots data records on a map, useful for displaying locations. You can select fields for the address, latitude, and longitude.
- Sheets View: Displays data in a sheet format similar to Excel or Google Sheets. You can select fields to display, set default values, and enable options for inserting or deleting records.
- Calendar View (Beta): Displays records in a calendar format, which is especially helpful for showing bookings, appointments, or meetings. You can select fields for date and title to be plotted on the calendar.
Cache Time Option
All views (except Sheets) have a cache time setting, defaulting to 10 minutes. This setting caches the data for the specified time, helping reduce server load and improve performance. You can adjust the cache time as needed down to 0 or up to one hour.
On-Click Navigation
All views (except Sheets) have an "On Click" option, allowing you to define where the screen should navigate when a user clicks on a record. You can choose from a list of screens to determine the destination.
Overall, the Summary Screen offers a flexible way to display and interact with data from multiple sources, with various customization and filtering options to suit different needs.